← CloudScale Plugin Help/CloudScale Cleanup, Free WordPress Database Cleaner, Image Optimizer & Cron Manager
Site Health
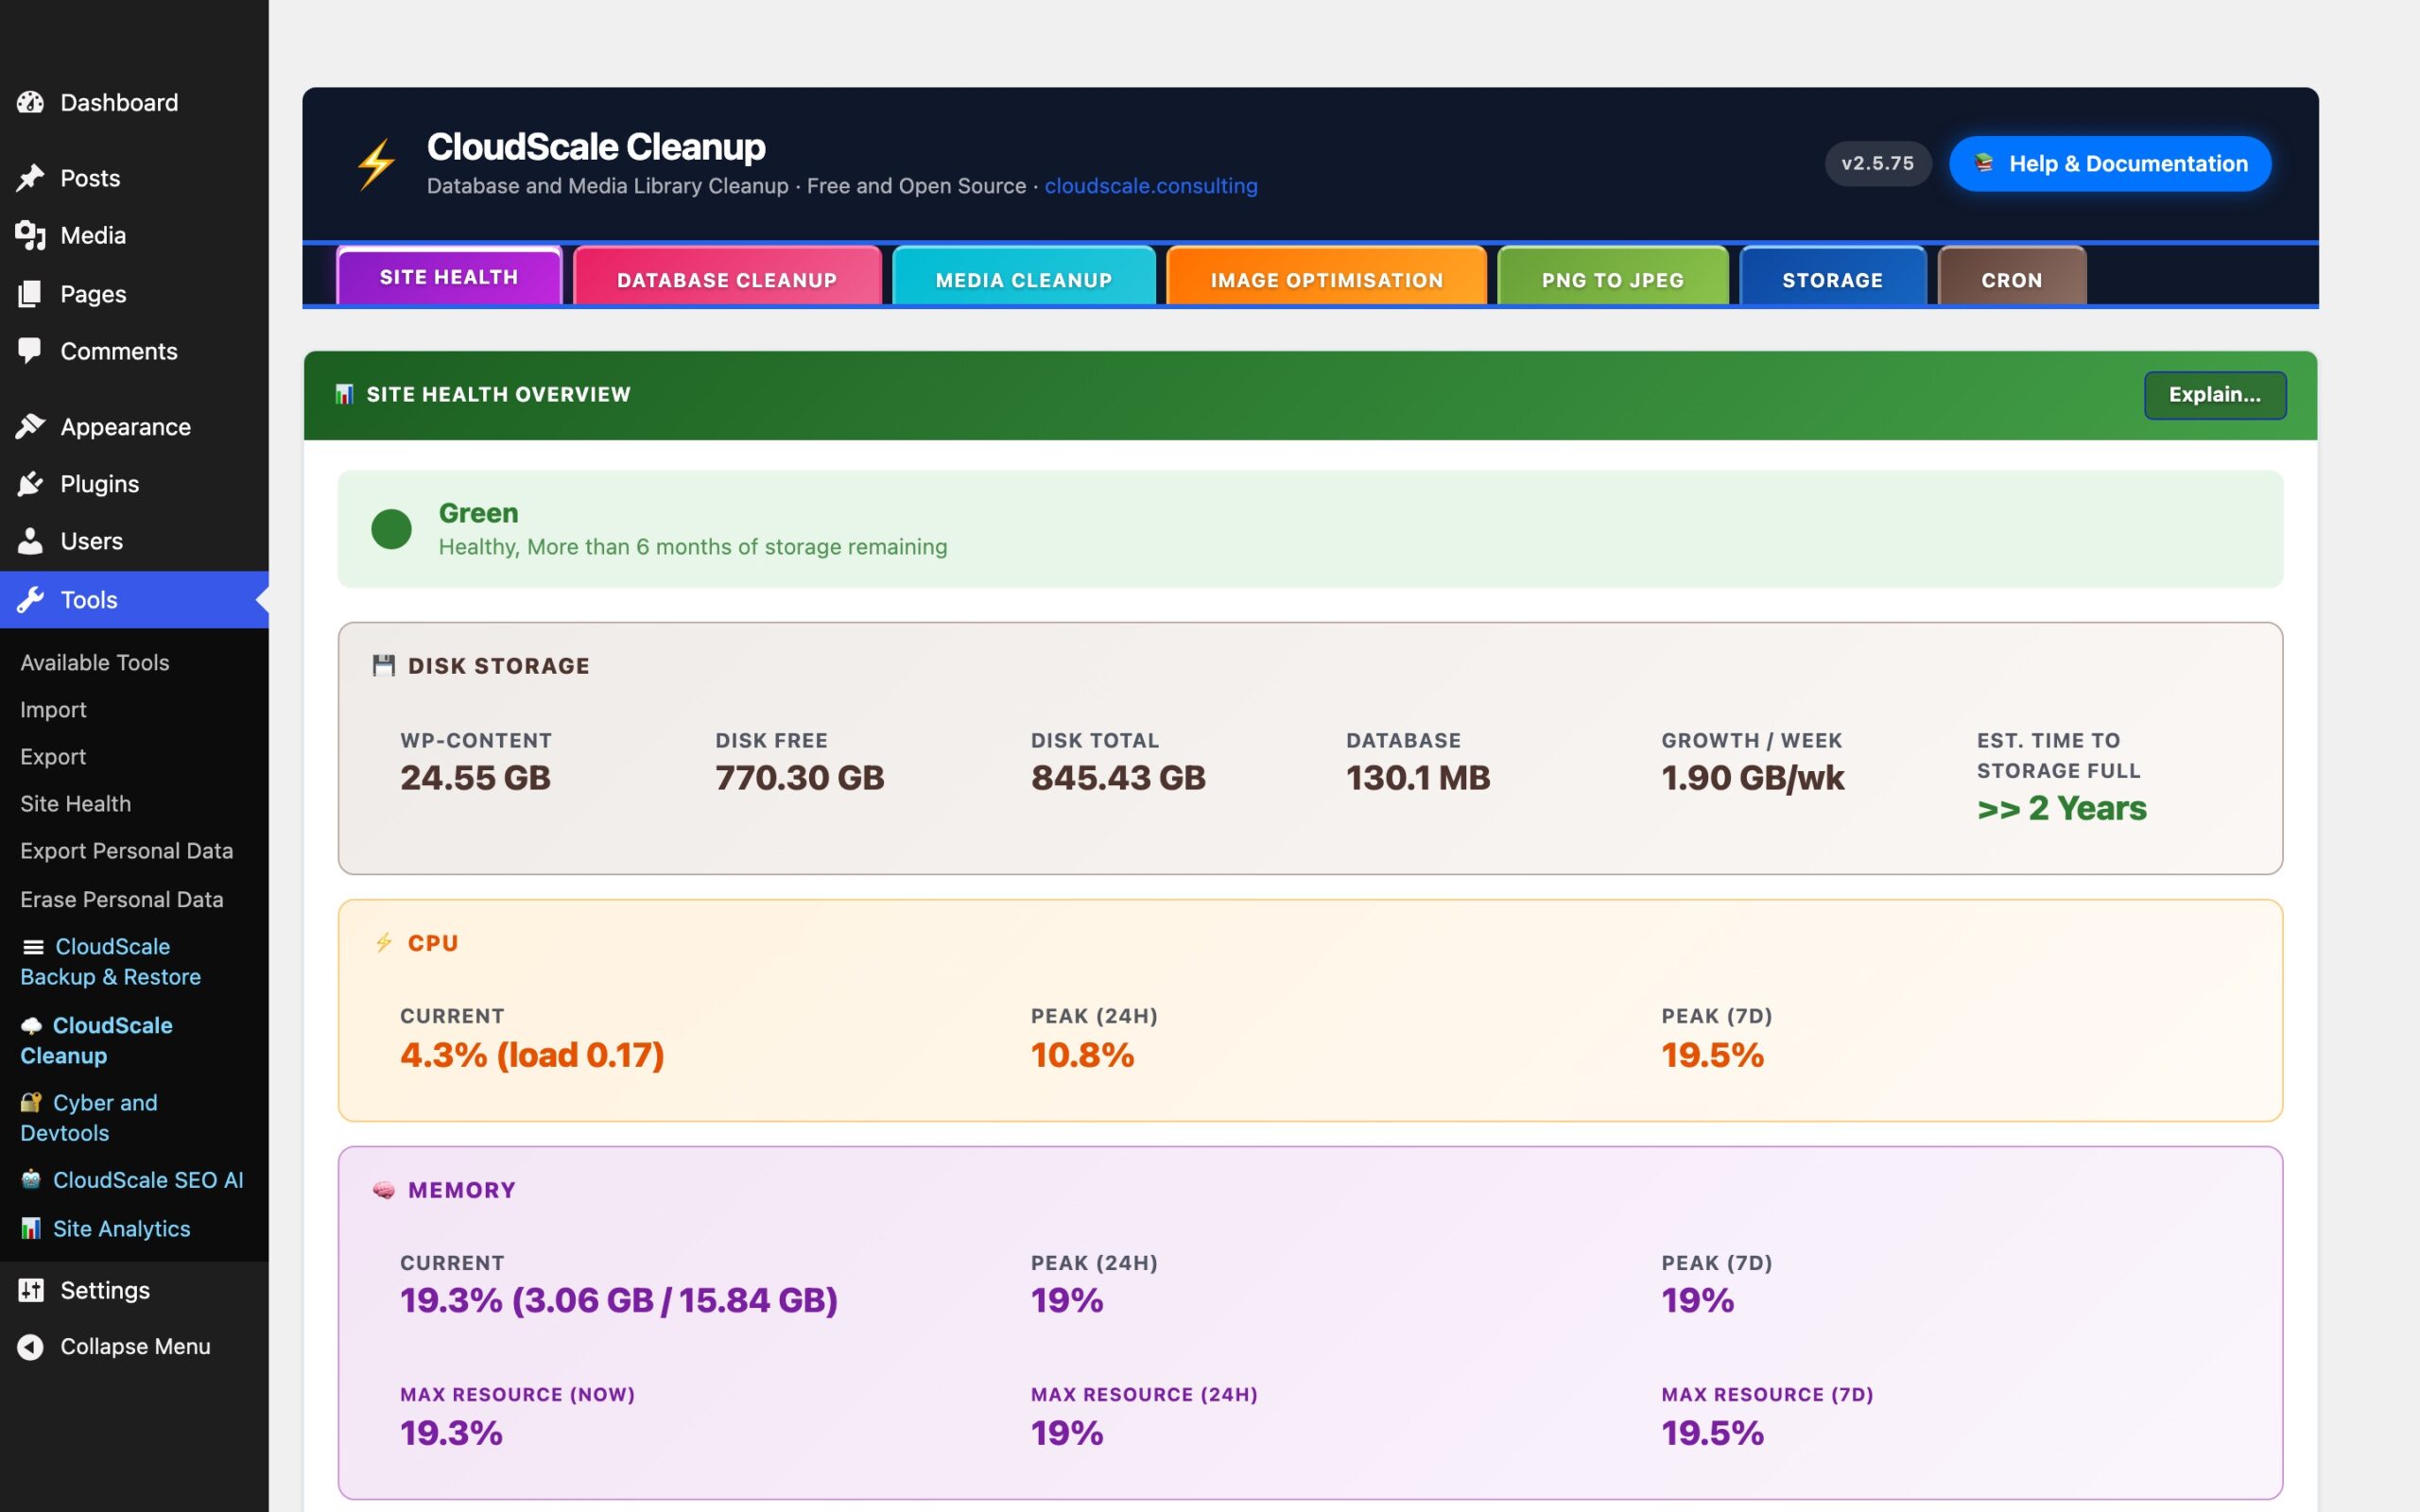
The Site Health tab is a live server metrics dashboard. It collects disk storage, CPU, and memory data automatically in the background and presents it as a RAG (Red/Amber/Green) status indicator so you can spot problems before they affect your site.
Storage RAG indicator
The coloured banner at the top of the tab summarises your storage runway:
- Green, 6 or more months of disk space remaining at current growth rate.
- Amber, 3 to 6 months remaining. Consider running a cleanup or archiving old uploads.
- Red, under 3 months remaining. Immediate action recommended.
- Grey (Collecting), fewer than two weekly snapshots have been recorded yet. The estimate requires at least two data points to calculate a growth rate.
Metric groups
Disk Storage
- Used, total disk space consumed by the entire server filesystem.
- Free, available disk space.
- Total, total filesystem capacity.
- Database Size, the combined size of all tables in the WordPress database.
- Growth/Wk, average weekly storage increase, calculated from up to 3 months of weekly disk snapshots. Shown as “Stable / shrinking” if growth is zero or negative.
- Est. Wks to Full, at the current growth rate, how many weeks before the disk fills. Shown as “>> 2 Years” when the estimate exceeds 104 weeks. Colour-coded to match the storage RAG.
Note, local backups inflate the growth figure: If your backup plugin stores backup files on the same disk (inside wp-content or the server filesystem), each backup run adds to the measured disk usage. This pushes the Growth/Wk figure up and makes the Est. Wks to Full shorter than the real runway. If you store multiple backup generations locally, the growth rate only stabilises once the backup rotation reaches its maximum, at that point old backups are deleted as new ones are created, and net growth flattens. For example, if you allow 5 backup copies and each copy is 2 GB, the disk will grow by ~10 GB before the rotation kicks in and growth levels off. The Est. Wks to Full will appear alarming until that equilibrium is reached. The most accurate solution is to store backups on an external destination (S3, remote FTP, cloud), tools like CloudScale Backup can be configured with a maximum number of retained copies so that once the limit is reached, the oldest backup is deleted before the new one is written, keeping net disk growth at zero from backups.
CPU
- Now, current CPU usage percentage, with the load average in parentheses when sysstat is available.
- 24h Peak, highest CPU usage recorded in the last 24 hours.
- 7d Peak, highest CPU usage recorded in the last 7 days.
Memory
- Now, current memory usage percentage with used/total bytes.
- 24h Peak, highest memory usage in the last 24 hours.
- 7d Peak, highest memory usage in the last 7 days.
Autoload RAG, a separate indicator in the dashboard header tile shows the current WordPress autoload size (the data loaded from wp_options on every page request). Green = healthy, amber = elevated, red = excessive. This is a quick-glance signal to visit the Database Cleanup tab’s Autoloaded Options panel.
Data collection
Metrics are collected automatically by two WordPress Cron jobs registered by the plugin:
- Hourly (
csc_health_hourly_collect), records current CPU percentage and memory percentage. Up to 180 days of hourly samples are stored. - Weekly (
csc_health_weekly_snapshot), records disk used, disk free, disk total, and database size. Up to 3 months of weekly snapshots are stored.
All data is stored in wp_options with autoload=no so it does not add to the per-request payload. No data leaves your server.
Buttons
- Refresh, reloads the dashboard from stored data without running a new collection job.
- Collect Metrics Now, immediately fires both the hourly and weekly collection jobs. Use this on a fresh install to seed the first data points instead of waiting for the scheduled cron to run. A confirmation modal explains what will happen.
- Test Sysstat, runs a server-side check to determine whether the
sarcommand from thesysstatpackage is installed, active, and returning data. Results are shown inline with colour-coded status and, where applicable, installation instructions.
sysstat (sar), accurate CPU and memory peaks
Without sysstat, the plugin takes an instantaneous snapshot of the load average from /proc/loadavg and memory from /proc/meminfo at the exact moment the hourly cron job runs. On a quiet server these snapshots are often 0% because they capture a single idle second rather than the busiest period of the last hour.
sysstat samples the system continuously every 10 minutes and writes the data to /var/log/sa/. When it is installed and active, the plugin queries sar for the actual per-minute maximum over the past 60 minutes, a far more accurate representation of real CPU and memory usage.
Install and enable on Amazon Linux / RHEL:
sudo yum install sysstat -y
sudo systemctl enable sysstat && sudo systemctl start sysstat
sudo systemctl enable sysstat-collect.timer && sudo systemctl start sysstat-collect.timer
Install and enable on Ubuntu / Debian:
sudo apt install sysstat -y
sudo systemctl enable sysstat && sudo systemctl start sysstat
sudo systemctl enable sysstat-collect.timer && sudo systemctl start sysstat-collect.timer
Verify data is being collected:
LC_ALL=C /usr/bin/sar -u 2>&1 | tail -5You should see rows of CPU timestamps and percentages. If you see only a header with no data rows, the sysstat-collect.timer is not running. On Amazon Linux 2023, enabling the sysstat service alone is not sufficient, the collect timer must also be enabled separately. Use the Test Sysstat button to confirm the plugin can read data successfully.