← CloudScale Plugin Help/CloudScale Cyber and Devtools: Free WordPress Security, AI Penetration Testing & Developer Toolkit
Server Logs
Browse your PHP error log, WordPress debug log, and web server logs directly in the dashboard, with live search, severity filtering, and auto-refresh tail mode. No SSH, no cPanel, no asking your hosting provider to email you a file.
📋 Read Your Server Logs Without Leaving WordPress
When something breaks on a WordPress site, the answer is almost always in a log file. But accessing logs normally means SSH access (which many hosting plans don’t provide), navigating a cPanel file manager, or asking your hosting provider to email you a file. For agency developers, that means waiting. For site owners on shared hosting, that means never seeing the logs at all.
Query Monitor shows database queries and hooks but not server-level PHP or Nginx/Apache logs. Debug Bar only surfaces WP_DEBUG output. Neither replaces direct log access. CloudScale gives you the actual log files (PHP errors, WordPress debug output, and web server logs) in a clean, searchable interface inside wp-admin, with no SSH required.
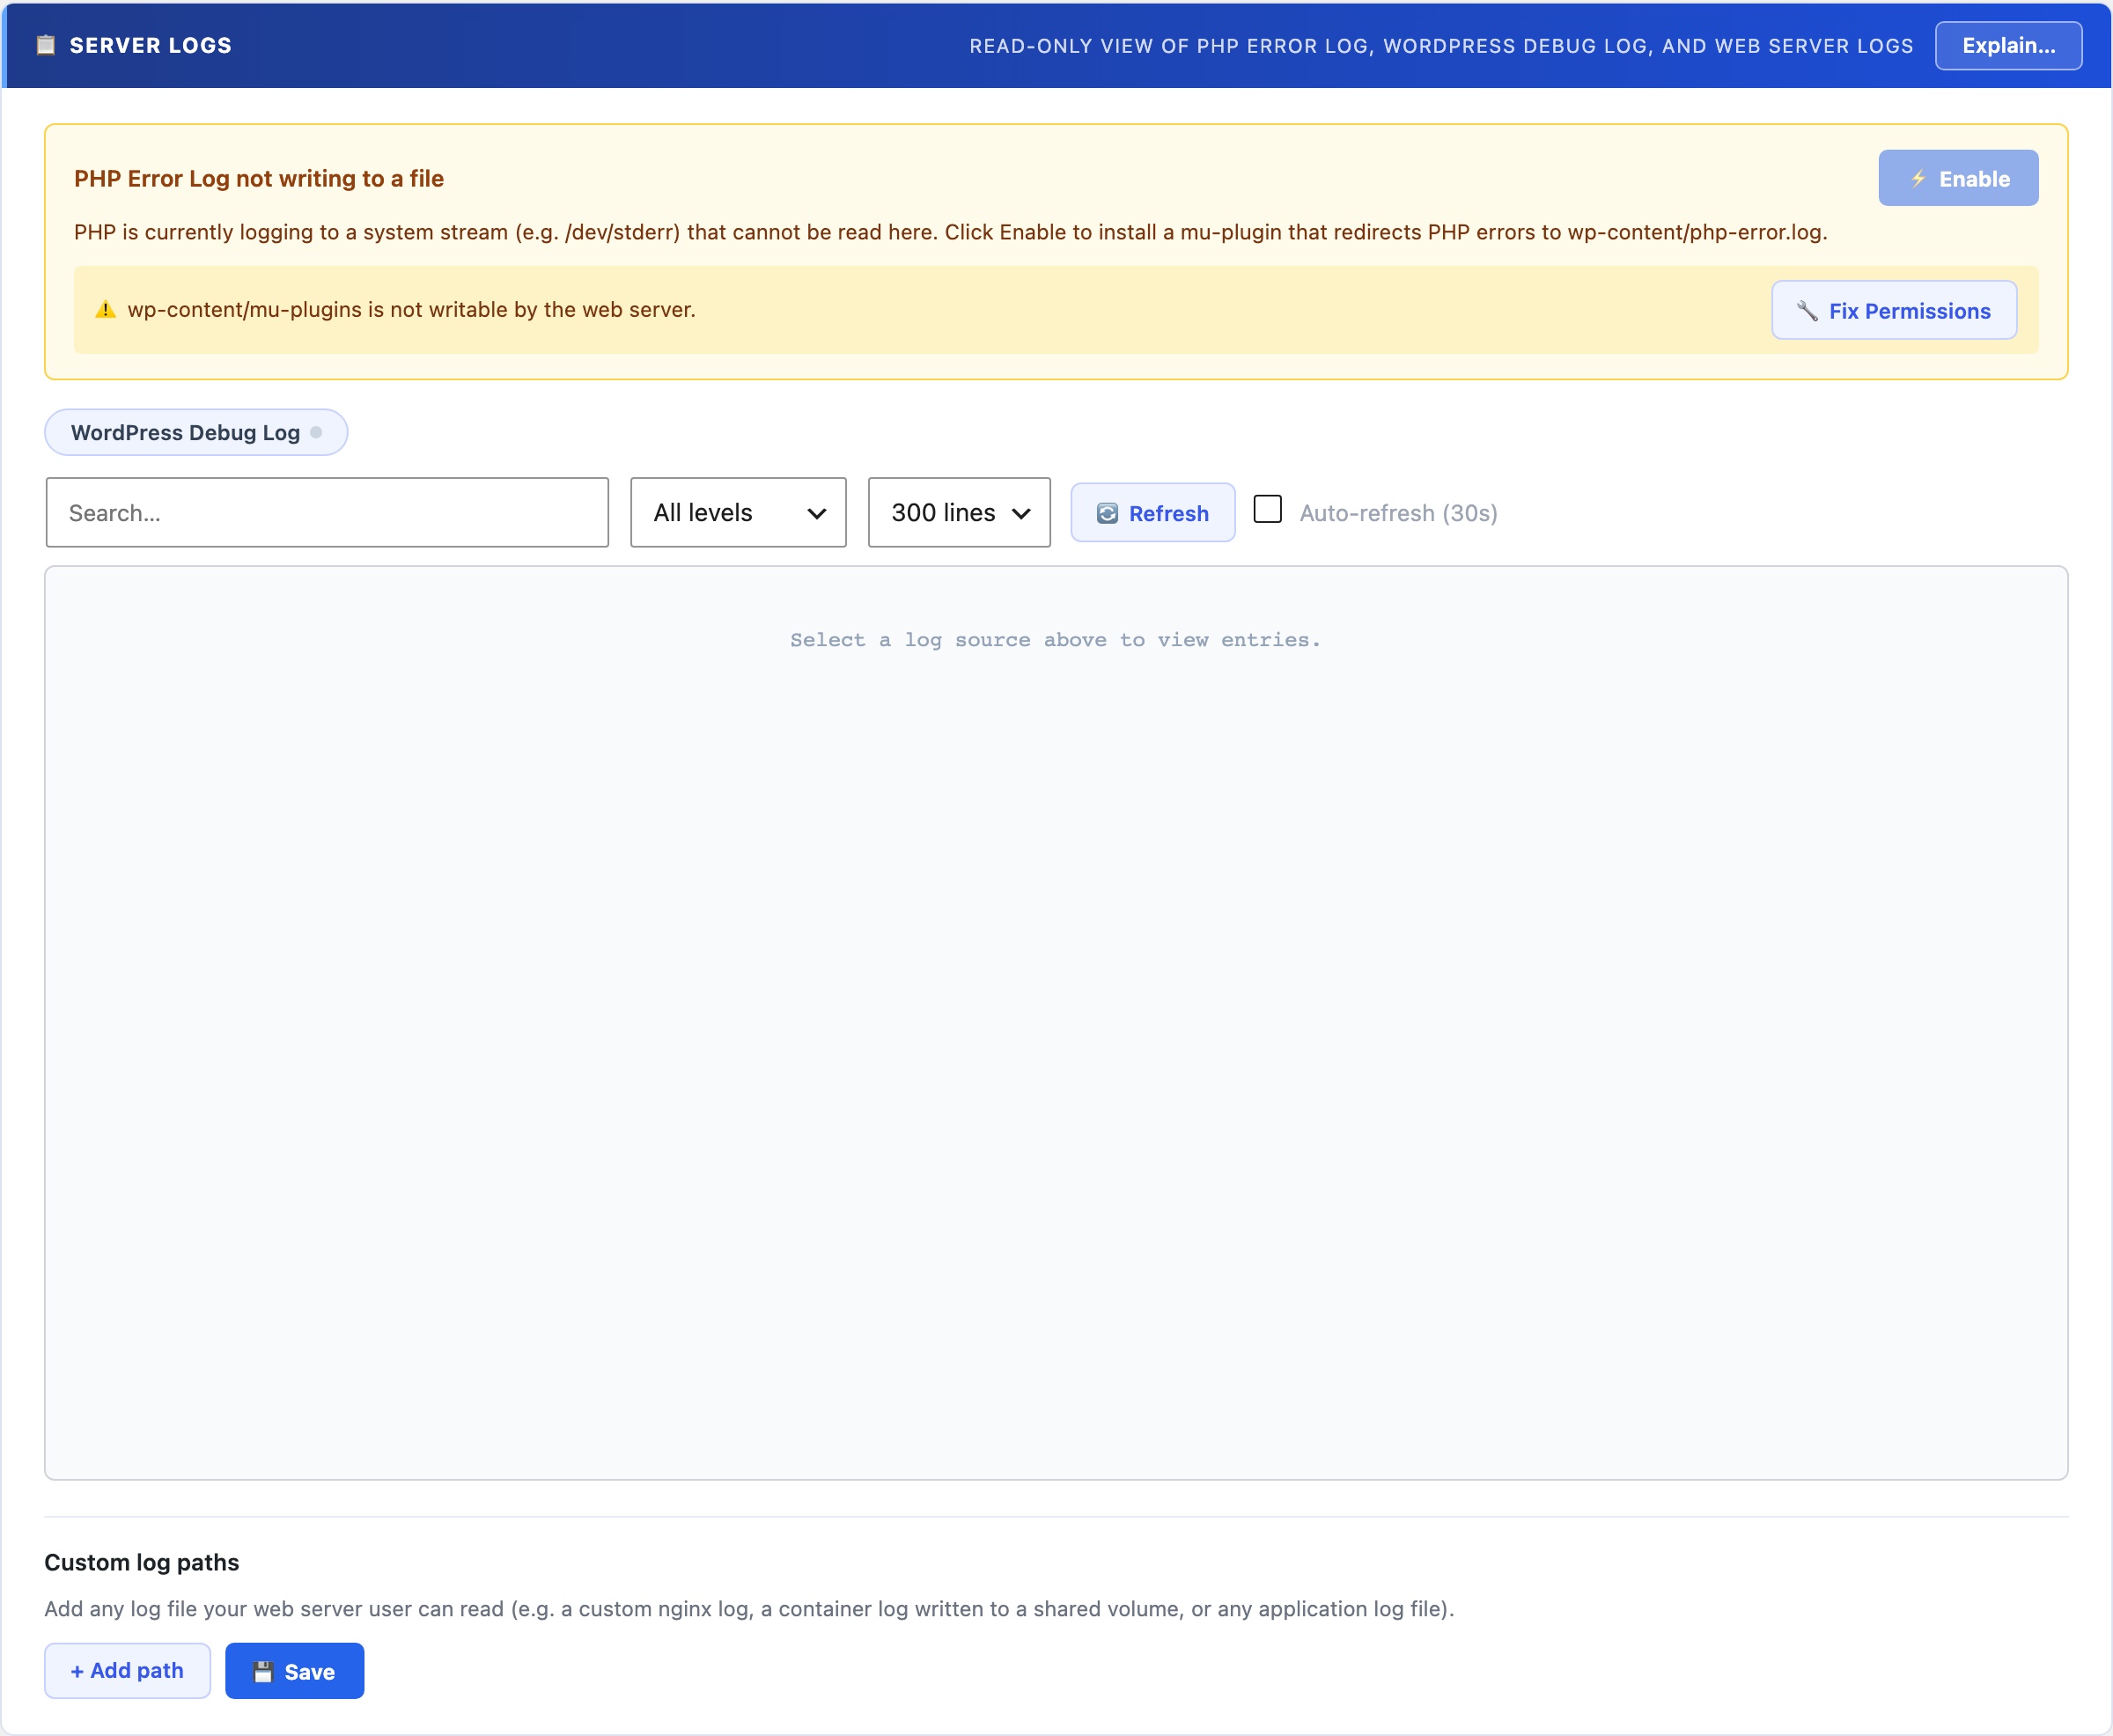
All your log sources in one place: The source picker lists every available log file with a live status indicator (readable, not found, permission denied, or empty). Switch between PHP error log, WordPress debug log, and web server access/error logs with a single click.
Live search filters entries as you type with highlighted matches, which is essential for finding a specific error in a log with thousands of lines.
Severity filter narrows results to Emergency, Alert, Critical, Error, Warning, Notice, Info, or Debug. Cuts through noise on busy production sites where Info and Debug lines dominate.
Auto-refresh tail mode polls for new entries every 30 seconds. Reproduce a bug in one browser tab while watching the log update in real time in another. It’s the fastest way to trace an intermittent error.
Custom log paths: add any file path (Nginx error log, a custom application log, a cron output file). Paths persist across sessions.
One-click PHP error logging setup: if PHP error logging isn’t configured on the server, a button writes the required php.ini directives automatically. No server configuration knowledge required.
Server Logs as a Performance and Debugging Tool
The Server Logs panel is not just for security incidents. It’s the fastest way to trace a performance problem to its root cause without SSH access. Load a slow-performing page in one tab, watch the PHP error log update in tail mode in another, and see exactly which hook or database query is generating warnings on that specific page. Reproduce an intermittent 500 error and catch the exception the moment it fires. Find the exact plugin throwing deprecated notices that is degrading your PHP performance score.
For growth and marketing teams: the auth log source (where SSH brute-force attempts are recorded) gives you a real-time picture of attack traffic against your server, useful context for understanding infrastructure load and the value of the protection CloudScale provides.