← CloudScale Plugin Help/CloudScale Cyber and Devtools: Free WordPress Security, AI Penetration Testing & Developer Toolkit
FPM Monitor
PHP-FPM (FastCGI Process Manager) is the process pool that serves every WordPress page request. When all workers are occupied, during a traffic spike, a slow database query, or a runaway loop, new requests queue and the site freezes. The FPM Monitor shows live worker counts and memory usage, and alerts you the moment saturation builds, running as a host-level script outside PHP so it fires even when every PHP worker is consumed.
🖥️ Know When Your PHP Workers Are Exhausted, Before Your Site Goes Down
PHP-FPM (FastCGI Process Manager) maintains a fixed pool of worker processes. When all workers are busy, during a traffic spike, a slow query holding workers open, or a runaway loop, new requests queue and the site freezes. WP-Cron can’t alert you when this happens because WP-Cron itself runs inside PHP-FPM. The FPM Monitor runs as a shell script on the host OS, outside Docker, so it fires even when every PHP worker is consumed.
No other WordPress plugin does this. External uptime monitors just tell you the site is down after it’s already down. The FPM Monitor tells you saturation is building while you can still act, and can restart the container automatically.
Live Worker Status
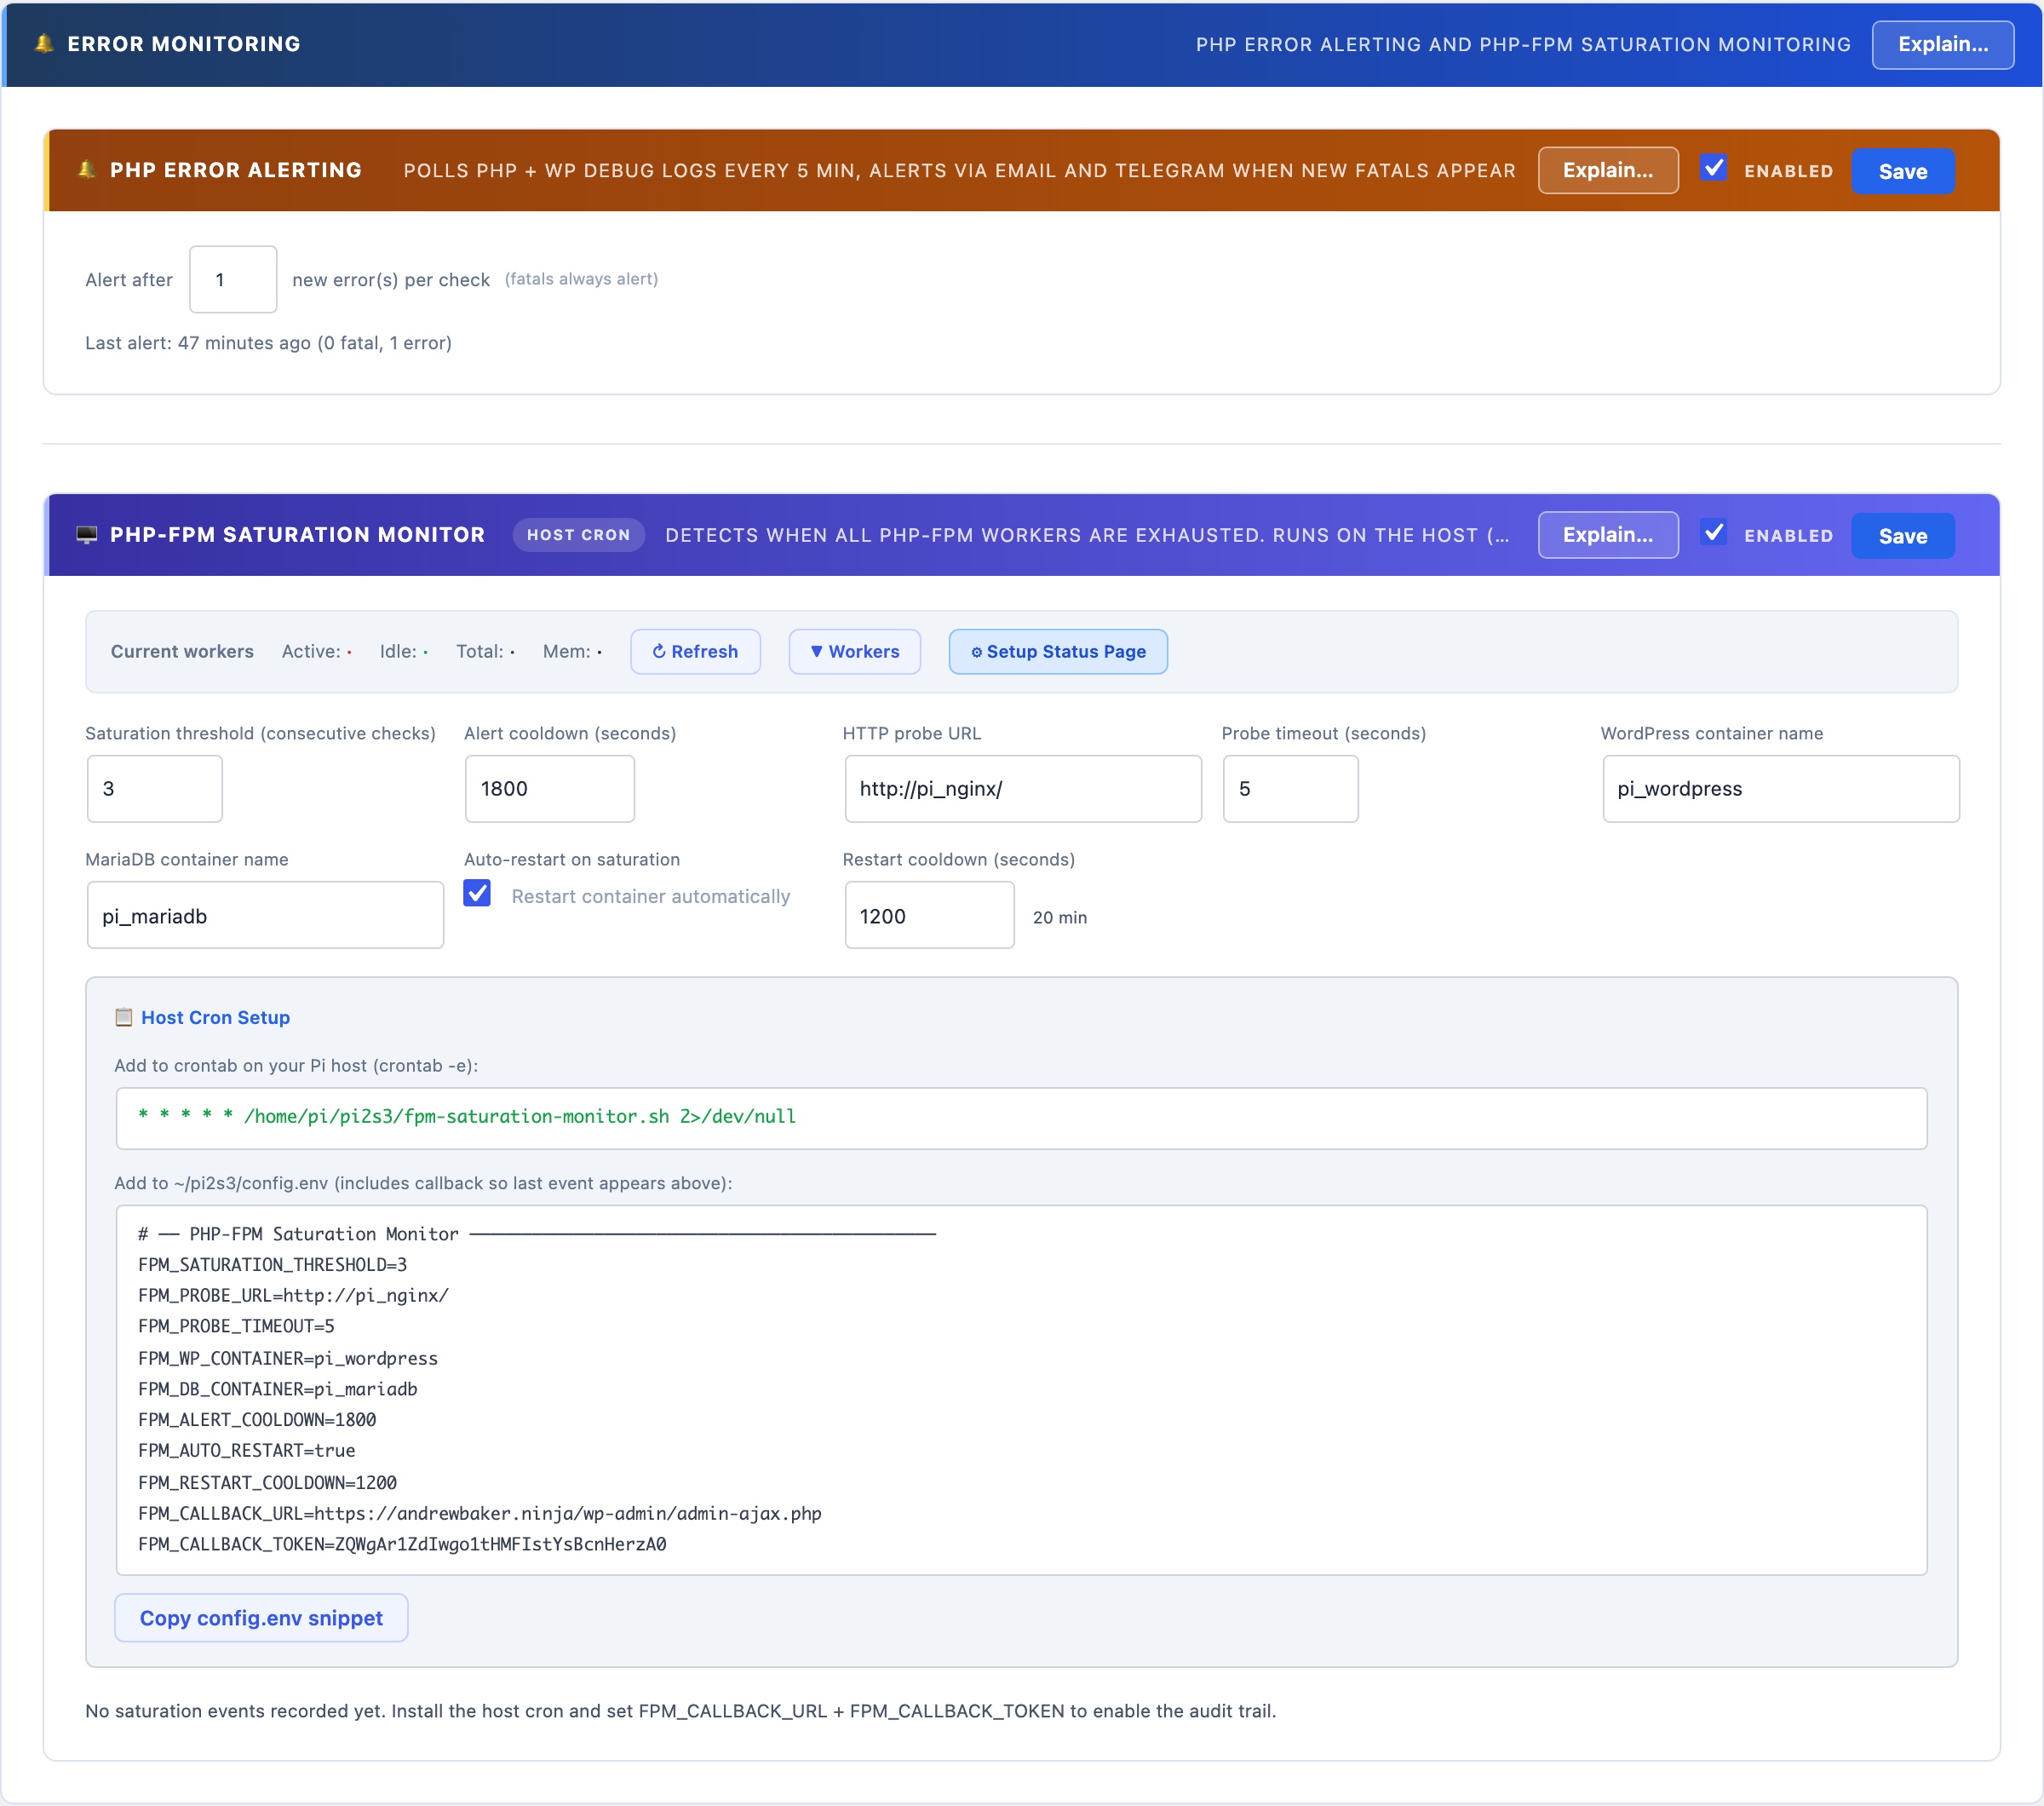
The worker bar at the top of the FPM Monitor section shows real-time counts polled from your PHP-FPM status page:
- Active, workers currently processing a request (shown in red when high)
- Idle, workers ready to accept a new request (shown in green)
- Total, pool size: active + idle + any in graceful-finish state
- Mem, total memory consumed across all workers combined
Click ▼ Workers to expand a per-worker table showing PID, state, request count, running time, last URI, last script, last CPU%, and memory per worker. Running workers show , for CPU% because their current request hasn’t completed yet. Click ↻ Refresh to re-poll at any time.
Enabling the Status Page
Worker data requires pm.status_path = /fpm-status in your PHP-FPM pool config (www.conf) and a matching Nginx location block. Click ⚙ Setup Status Page and the wizard will detect whether your setup is already configured, show you the exact config changes needed, and offer to apply them automatically.
Saturation Detection and Alerts
The monitor runs as a host-level cron job (not WP-Cron) that probes your site’s HTTP URL every minute. If the probe times out or fails N consecutive times (the saturation threshold), saturation is declared. On saturation it:
- Sends an ntfy.sh push notification to your phone instantly
- Sends an email alert to the WordPress admin address
- Optionally restarts the WordPress Docker container (with a configurable restart cooldown to prevent thrashing)
- POSTs an event back to this panel via the callback URL, logging the incident in the event log
Setup
Configure the settings in the panel, then copy the crontab line and config.env snippet from the Host Cron Setup section. The config includes the callback URL and a secret token that authenticates events back to this panel. Add the crontab line to your host’s crontab with crontab -e, and source the config.env from your cron script. The monitor starts detecting saturation immediately.
Auto-restart: when enabled, the script issues docker restart {container} after declaring saturation. Use with care on production, a restart drops all in-flight requests. The restart cooldown (default: 20 minutes) prevents the script from restarting more than once per incident.