← CloudScale Plugin Help/CloudScale Cyber and Devtools: Free WordPress Security, AI Penetration Testing & Developer Toolkit
CS Monitor
A floating DevTools-style performance panel that appears on every WordPress admin screen and frontend page for logged-in administrators. Surfaces database queries, HTTP calls, hook timings, PHP errors, assets, and template resolution in one overlay, without switching tools or tailing log files.
⚡ A DevTools-Style Performance Panel, Built Into Every WordPress Page
Query Monitor shows database queries. Debug Bar surfaces WP_DEBUG output. Neither one shows you everything happening on a single page request, HTTP calls, hook timings, PHP errors, asset inventory, transients, and template resolution, in one panel without switching tools or reading raw logs. CS Monitor does.
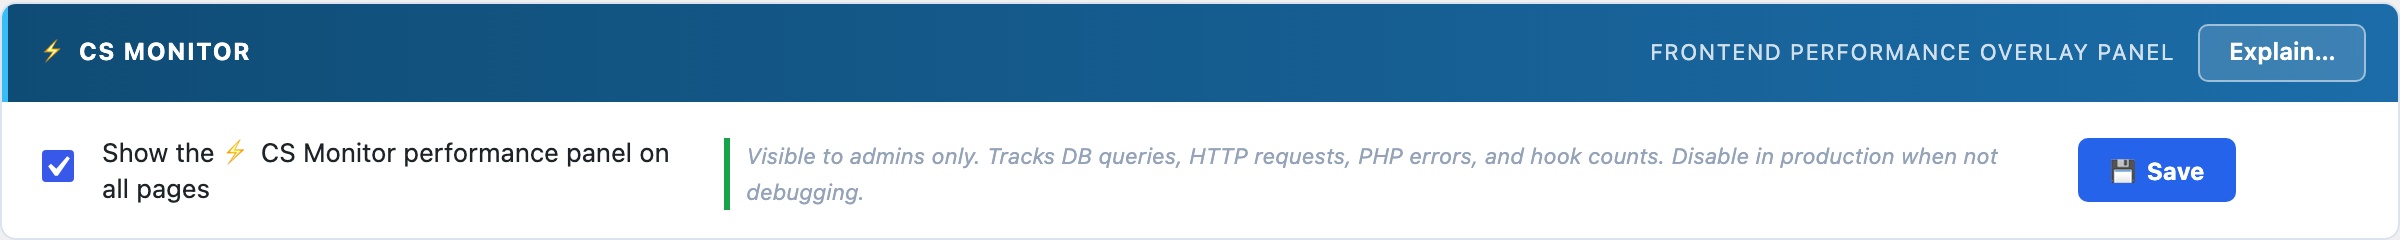
It appears automatically for logged-in administrators on every wp-admin screen and every frontend page. No configuration required. Toggle it off under Code Settings → Show the CS Monitor performance panel if you need a clean view.
Performance problems on WordPress sites typically involve one of a small number of root causes: too many database queries (especially N+1 query patterns from plugins iterating through posts), slow external HTTP calls blocking page generation, PHP errors generating notices that get logged and cause overhead, or an asset-heavy theme loading scripts on every page whether they are needed or not. The difficulty is that none of these are visible from the outside, your site’s pages load slowly and you cannot tell from the browser why. CS Monitor captures all of these simultaneously for every page request and surfaces them in a single overlay so you can pinpoint the cause without SSH access, log file analysis, or installing additional profiling tools.
CS Monitor only activates for logged-in administrators. Regular visitors see no difference and incur no overhead. This means you can leave it enabled on live production sites without any impact on visitor experience or page load times. It is always-on for you, invisible to everyone else.
Panel Tabs
- Issues: auto-detected problems ranked by severity, N+1 query loops, slow queries over 100ms, high total query count, OPcache not enabled, missing database indexes on common lookup columns, and high memory usage. Each issue links directly to the relevant tab for investigation. Start here to see if there is anything worth investigating before browsing the raw data.
- DB Queries: every database query executed during this request, with execution time in milliseconds, the calling plugin or theme, and the PHP call stack. Click any SELECT query to run
EXPLAINinline and see the query execution plan, instantly shows whether a full table scan is occurring. N+1 query patterns (the same query fired repeatedly in a loop) are grouped and flagged automatically, making them easy to spot even if no individual query is slow. - HTTP / REST: all outbound HTTP calls made via
wp_remote_get,wp_remote_post, and internal REST API requests, with the full URL and response time. Slow external API calls (payment gateways, social embed fetches, external font requests) that block PHP page generation are immediately visible here. If your pages feel fast in the browser but slow to generate server-side, this tab often shows the culprit. - Logs: PHP notices, warnings, deprecation notices, and errors captured for the current request, with the originating file and line number. No need to tail a log file or wait for a scheduled scan. If a plugin is generating deprecation warnings on every page load, you will see exactly which plugin and which line is responsible.
- Assets: every script and stylesheet registered and enqueued for the current page, with its source plugin or theme. Use this to identify asset bloat, plugins loading their full CSS and JS on pages where they have no UI, themes loading icon fonts for icons that don’t appear on the current template.
- Hooks: all WordPress action and filter hooks that fired during the request, with execution time per hook. A hook taking 200ms on every page request is a performance problem regardless of how fast the database queries are. Find the slow hooks and trace them back to the plugin responsible.
- Request: current request details including HTTP method, full URL, the matched WordPress rewrite rule, active query variables, and key WordPress globals. Useful for debugging routing problems, custom post type URL issues, and template selection.
- Template: the full chain of template files WordPress evaluated to serve the current page, in the order they were loaded. Use this to understand which theme file is generating the current page and trace layout problems back to the right file without guessing.
- Transients: every transient read, write, and delete operation triggered during the request, with the transient name and expiry. Shows which plugins are caching data and whether caches are hitting or missing.
- Browser: JavaScript console errors and unhandled promise rejections captured client-side and reported back to the panel via a small inline script. Catch JS exceptions and React hydration errors without opening browser DevTools. Useful on pages where you cannot easily open DevTools (mobile admin, certain embedded views).
- Summary: the request totals at a glance, total query count, combined query execution time, hook count, HTTP call count, peak memory usage, and total wall-clock page generation time. Use this for before/after comparison when profiling plugin changes.
Copy and Export
Every tab has a Copy button that puts the current tab’s data on your clipboard as plain text, ready to paste into a bug report, a support ticket, or the AI Debugging Assistant. A full-panel JSON export is available from the Summary tab for sharing complete request profiles with developers or hosting support.
Performance Impact
CS Monitor adds a small overhead from hooking into SAVEQUERIES and the WordPress shutdown action to collect data. This overhead is only incurred for logged-in administrators, regular visitors are completely unaffected. The panel can be disabled globally under Tools → Cyber and Devtools → Code Settings → Show the CS Monitor performance panel, or closed on a per-page basis using its close button.