← CloudScale Plugin Help/CloudScale Site Analytics, Free Privacy-First WordPress Analytics Plugin
Insights
A rich analytics dashboard showing how your content performs across traffic sources, referrer domains, geography, and time, with a Smart Summary, KPI cards, pie charts, line charts, a peak traffic hours heatmap, a referrer timeline, audience new/returning bars, top-posts-by-referrer table, and top landing pages per referrer. Includes a Self toggle to filter internal navigation from all charts at once.
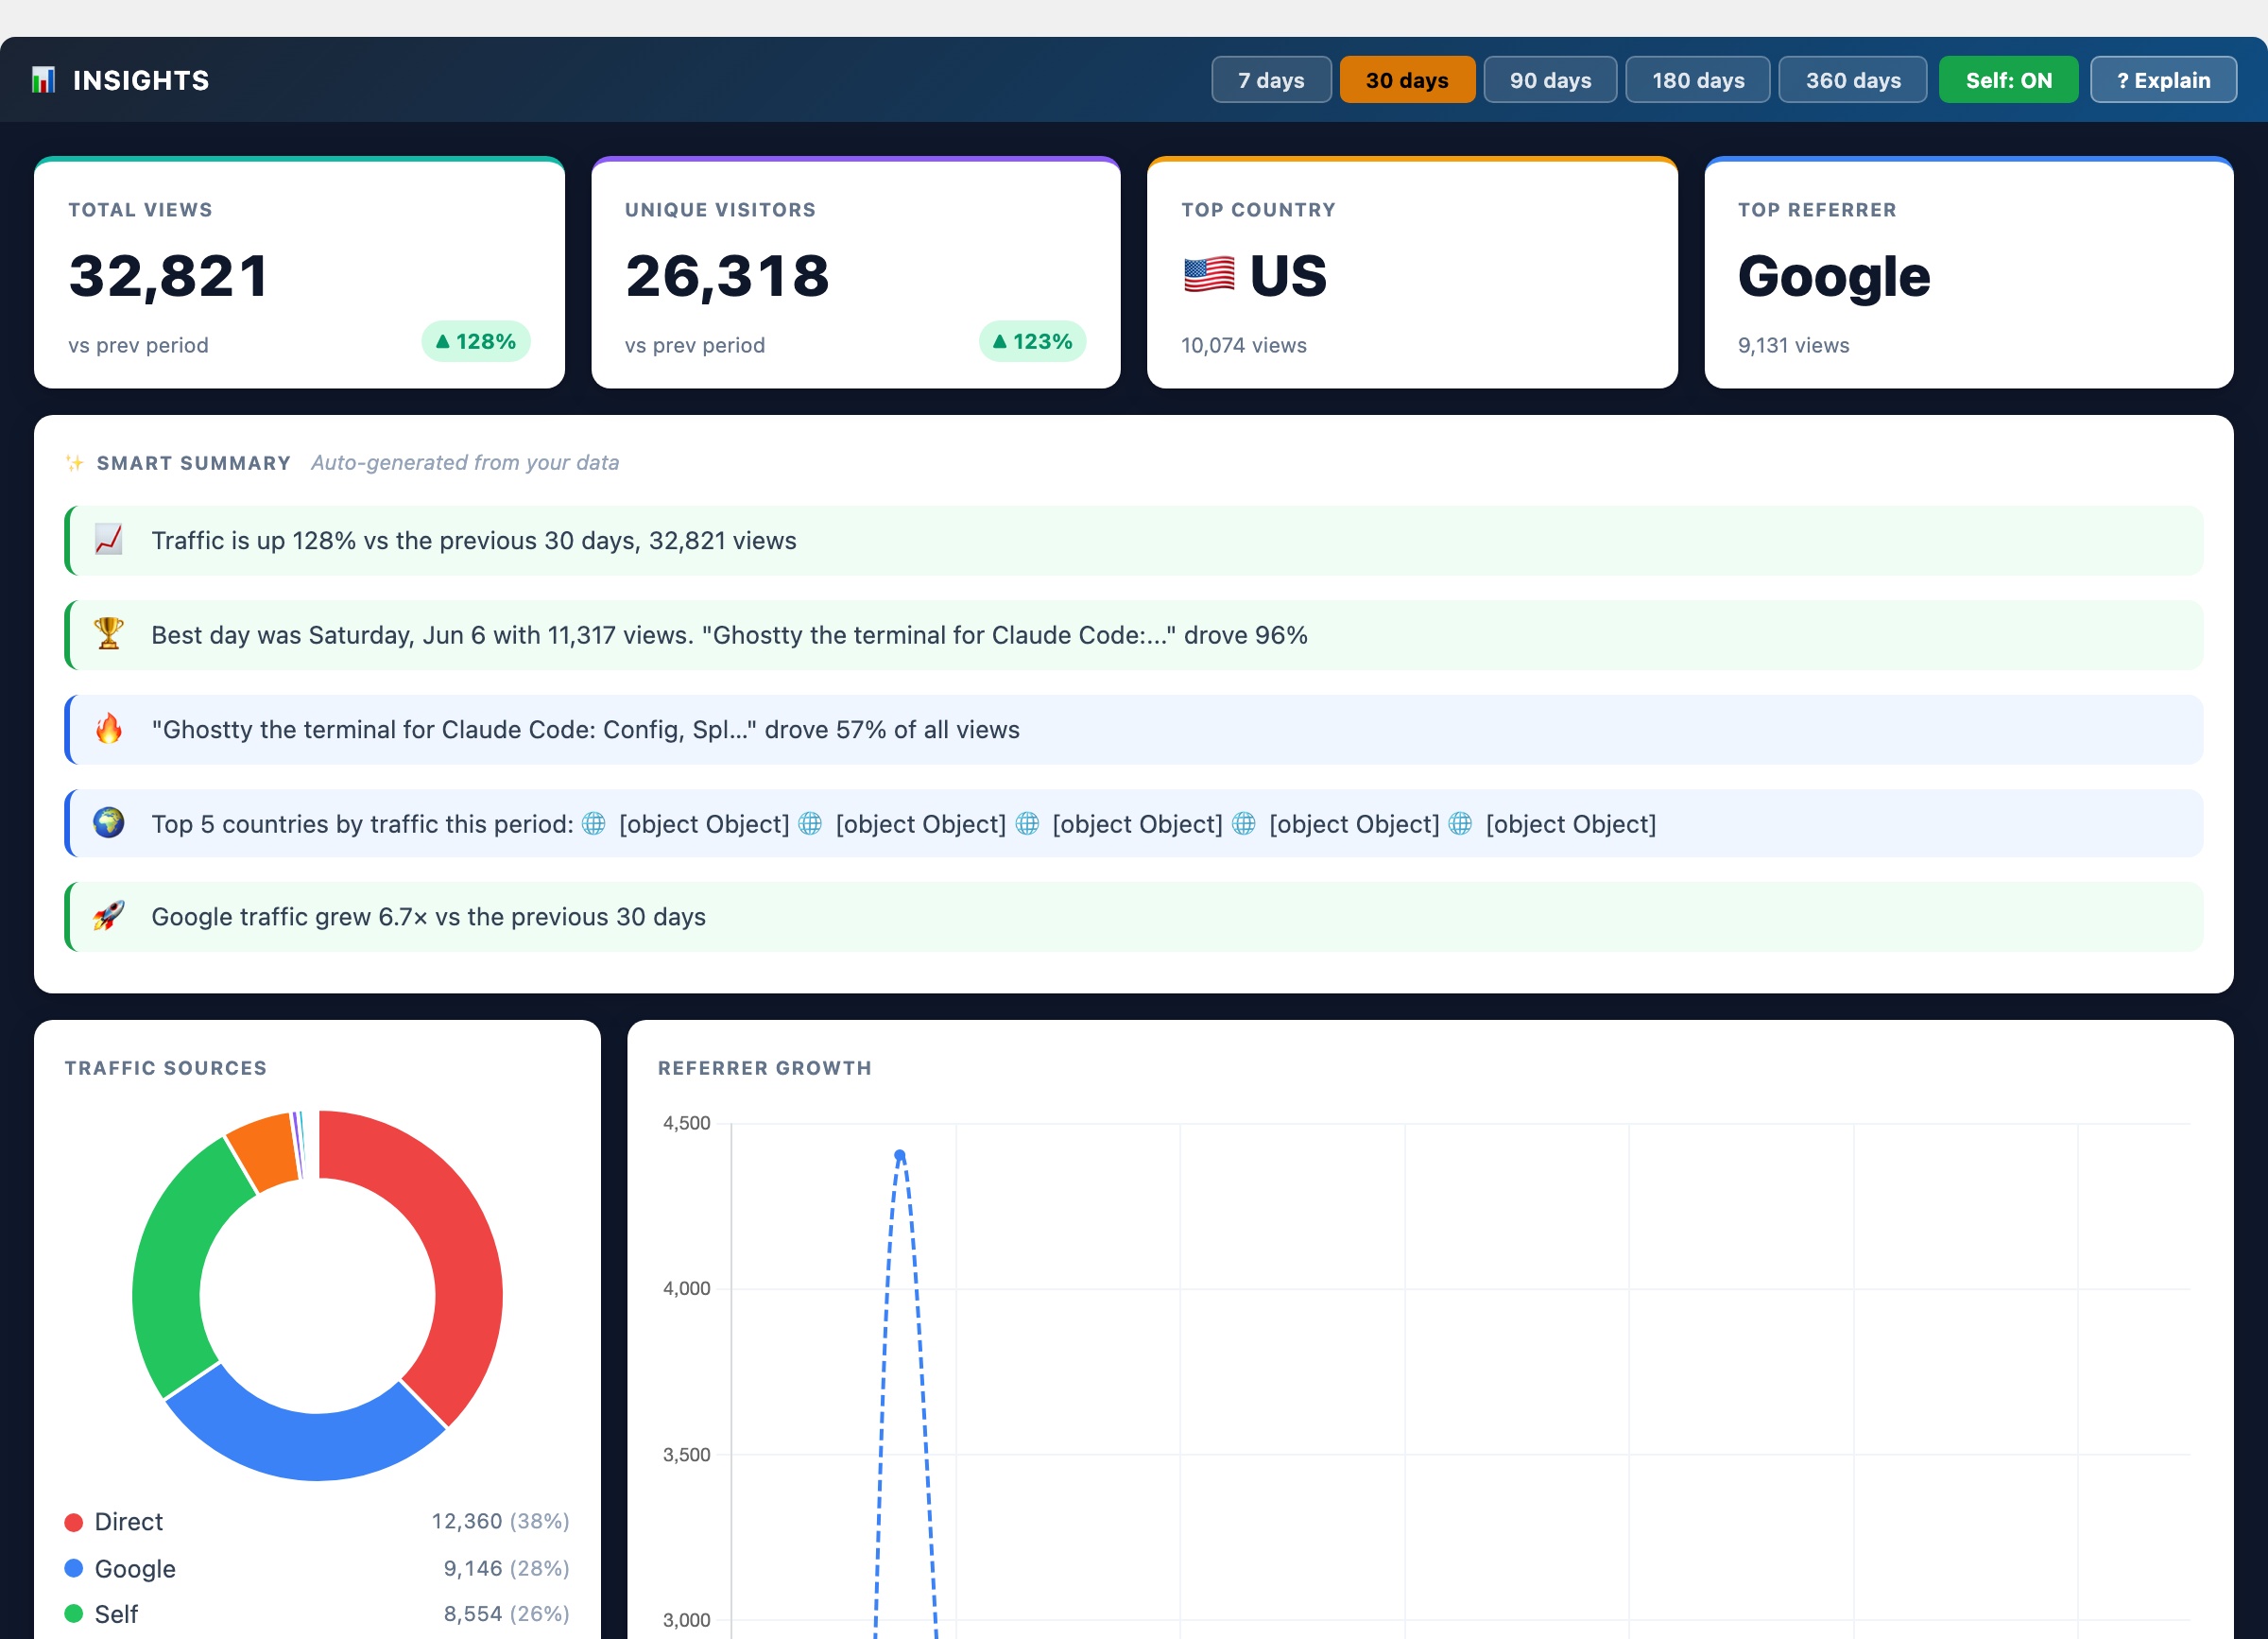
The Insights tab provides a rich analytics dashboard loaded on demand when you open the tab. Use the period buttons (7 / 30 / 90 / 180 days) in the header to change the time window, all charts update together. Each chart has an ? Explain button that opens context-specific documentation inline.
Self Toggle
The Self: ON/OFF button at the top of the Insights tab filters Self traffic, visits where your own domain was the HTTP referrer, out of every chart, table, and KPI card simultaneously, without re-fetching data from the server. For sites where internal navigation accounts for the majority of referrals (often 80 to 90%), toggling Self OFF makes it far easier to evaluate external acquisition channels. Toggle it back ON to include all traffic again.
Smart Summary
A plain-English summary card at the top of Insights, auto-generated from your data each time the tab loads. It reads your KPI values, referrer distribution, and trend direction for the selected period and produces 3 to 5 bullet points that highlight what actually changed, e.g. “Google drove 62% of views, up from 44% last period” or “Your top post accounted for 38% of all traffic.” No AI API key required: the summary is generated locally by pattern-matching your own numbers. Use it to quickly orient yourself before diving into the charts.
KPI Cards
Four summary metrics for the selected period: Total Views, Unique Visitors (distinct visitor hashes), Top Country (most views by geography), and Top Referrer (highest-traffic source domain). When Self is OFF, Total Views, Unique Visitors, and Top Referrer all exclude Self traffic so the numbers reflect external acquisition only.
Traffic Sources
A doughnut chart breaking all views by how the visitor arrived. Known search engines (Google, Bing, DuckDuckGo, Yandex, Baidu, Ecosia) and social networks (LinkedIn, Facebook, Twitter/X, Reddit, Instagram, Pinterest) get their own labelled slices. Direct means no referrer header was sent, typed URL, bookmark, or email client. Self is internal navigation from your own domain (a reader clicking from one post to another). Slices that share similar hues automatically receive distinct canvas hatch patterns so they stay distinguishable at a glance.
Referrer Growth Timeline
A multi-line chart showing how each traffic source has trended over time. Known engines and social networks appear under their brand name; your own domain appears as Self; every other external site appears under its own hostname (e.g. news.ycombinator.com). Each line has a unique colour from a 20-hue vivid palette, a distinct dash pattern, and a distinct point shape so they remain readable even when many sources overlap. Periods of 30 days or fewer use daily buckets; longer periods use weekly buckets (ISO week start). Sources with zero traffic are hidden automatically.
Peak Traffic Hours
A 24-column heatmap showing when your audience is most active, broken down by hour of day. Each column is coloured from pale to deep red based on relative view density, a deep red column means that hour consistently receives the most traffic. Above the heatmap, a Best hour badge calls out your single highest-traffic time slot for the period. Use this to schedule social shares, email newsletters, or new post publications for maximum reach.
Top Posts by Views
A table ranking your most-viewed content for the selected period, with each post showing its total views and a new/returning audience split. The New / Returning bar shows the proportion of views from first-time visitors vs. returning readers, a post with a high new% is attracting fresh traffic (good for discovery content); a high returning% means readers are coming back (good for evergreen reference content). Hover any row for exact counts.
Top Posts by Referrer
A table showing up to 20 of your top posts with a view-count breakdown by traffic source. Columns are the top referrer sources for the period, including Self (internal navigation), named search engines, social platforms, and external domains. Rows alternate between white and a soft blue background for readability. Dashes indicate zero views from that source. Use this to identify which posts rank in Google, which spread on social, and which are discovered through your own internal links.
Top Landing Pages per Referrer
For each of your top referrer sources, this panel shows which specific pages on your site that source sent visitors to, along with the view count and a traffic share percentage. For example: “Google → /your-post-slug, 142 views (61%)”. This tells you which content ranks for organic search, which pages are linked from specific communities, and where to focus SEO or content efforts to grow a particular channel. Each referrer group is collapsible.
Views by Country
A doughnut chart showing the top 10 countries by view count for the selected period, built from the geo table. Hover for exact counts and percentages.
Top Countries Over Time
A multi-line chart for the top 5 countries, showing how geographic traffic shifts over the selected period. Useful for spotting when a post goes viral in a specific market or when SEO efforts in a new region start paying off.
Top Referrer Domains
A horizontal bar chart ranking the top referring domains. Self appears here when your own domain is the top source through internal navigation. Each bar uses a distinct vivid colour; similar hues get a hatch pattern automatically. Aggregated from full referrer URLs stored in wp_cspv_referrers_v2. Useful for identifying which sites, directories, or communities send you the most traffic.